- Top Results
- Bosch Building Technologies
- Security and Safety Knowledge
- Security: Video
- How To create BVMS memory dump?
How To create BVMS memory dump?
- Subscribe to RSS Feed
- Bookmark
- Subscribe
- Printer Friendly Page
- Report Inappropriate Content
 Find attached the French version of this article!
This article covers all important aspects of BVMS dump creation - error scenarios and corresponding dump creation methods.
Quick links:
BVMS dumps are needed to troubleshoot the following types of issues:
- Application crashes – dump is expected to provide more information about the cause of the crash and its origin.
- Memory or handle leaks – dump is expected to point to their origins
- Deadlocks, freezes and hangs – dump is expected to point to their origins
Recommended tool to create BVMS dumps.
The recommended tool is Procdump. It is a command line tool which must be started from the command shell. Bosch development team provides couple of .bat files that start Procdump with predefined parameters and cover the most common dump creation cases. The tool as well as the set of .bat files are attached to this article.
Batch files for dump creation
The batch file names follow a naming guideline: <Executable>_<Dump use case>
where <Executable> is one of:
- ConfigClient
- ConfigWizard
- OperatorClient
- ManagementServer
- ArchivePlayer
- ExceptionTest
and <Dump use case> is one of:
- SingleDump
- TwoDumps
- DumpOnException
E.g.
- batch file OperatorClient_SingleDump.bat immediately creates a dump of the Operator Client process,
- while OperatorClient_TwoDumps.bat creates two dumps of the Operator Client process with a delay of 1 hour between the dumps.
- OperatorClient_DumpOnException.bat creates a dump of the Operator Client process as soon as it throws an unhandled exception.
Note that also batches for executable "ExceptionTest.exe" are provided. These batches can be used for testing purposes - ExceptionTest.exe is a little test application that simply crashes when being started.
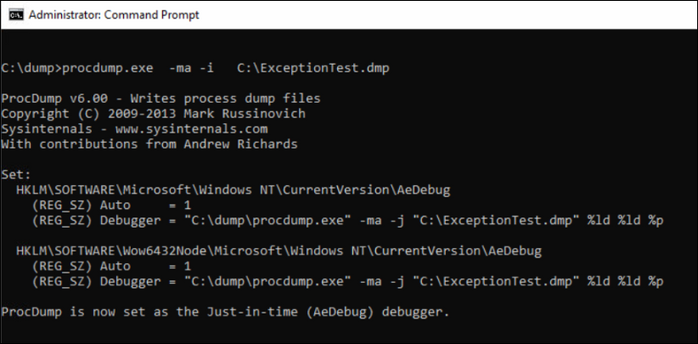
There is an additional batch file "ActivatePostmortemDebugging.bat" which registers procdump as Just-In-Time debugger.
Calling this batch will ensure that a dump is created when Windows Error Reporting is triggered by a crash.
To learn more about the advanced capabilities of the procdump tool, start batches ShowProcdumpHelp.bat and ShowProcdumpHelpSamples.bat. These batches display procdump options and some samples for how to use prodcump.
Error scenarios and corresponding dump creation methods
The procdump tool is useful for creating dumps for different problem scenarios:
Issues which can be easily reproduced
- application crashes which trigger windows error reporting
- memory or handle leaks
Issues which are hard to reproduce
- sporadic application crashes or crashes which do not trigger windows error reporting
- application sporadically becoming unresponsive (freezes/hangs)
Step-by-step guide
A. Dump creation for reproducible crashes that trigger Windows Error Reporting
To create a dump for a reproducible crash, follow these steps:
Note: attached you can find a configured example for this scenario and application Operator Client - BVMS_OC_dump_onException.zip |
B. Dump creation for reproducible memory or handle leaks
To create a dump for a memory/handle leak, follow these steps:
|
1.Run the affected application/service (Operator Client, Configuration Client). Note: Management Server Service is running by default. 2. Run the corresponding batch file for creating two dumps: *_TwoDumps.bat. E.g. run OperatorClient_TwoDumps.bat to create two dumps of the Operator Client process. Note that by default, the delay between the two dumps is set to one hour (3600 seconds). 3. Reproduce the steps that lead to the memory leak. Wait until the second dump was created. 4. Provide support with
Note: attached you can find a configured example for this scenario and application Operator Client, as well as additional examples - BVMS_DumpTools_V2.zip |
C. Dump creation for crashes/hangs/freezes that are hard to reproduce
It is impossible to create a manual dump for sporadic crashes/hangs/freezes or for those cases where a crash does not result in display of a Windows Error Reporting dialog. For these cases, procdump should be registered as just-in-time debugger.
To register procdump as just-in-time debugger, follow these steps:
Note: attached you can find a configured example for this scenario and application Operator Client - BVMS_OC_dump_Just-In-Time-Debuger.zip Note: after collecting the logs, please disable the debugger - delete the Auto and Debugger registry entries (they were created by command in point 2. Run ActivatePostmortemDebugging.bat )  |
Still looking for something?
- Top Results
