- Top Results
- Bosch Building Technologies
- Security and Safety Knowledge
- Security: Video
- DIVAR hybrid/ network - information required during the troubleshooting process
DIVAR hybrid/ network - information required during the troubleshooting process
- Subscribe to RSS Feed
- Bookmark
- Subscribe
- Printer Friendly Page
- Report Inappropriate Content
Introduction
Device information, Service log and network captures
In this section you can find details on what information is required during the troubleshooting process to successfully identify a unit in terms of model number, firmware version and unique identifiers. What is also very important always for the troubleshooting is the DIVAR Service log. In addition to that, in some situations network captures from the DIVAR may also be required.
Device information
- Model number
- Firmware version
- Serial number
- MAC addresses
- Network IP
- Detailed error description
- Is it about an error connection between DIVAR 2000 | DIVAR 3000 | DIVAR 5000 (Network/Hybrid) and Bosch Remote Portal? → Check the Operation Manual (7.2.2 DDNS chapter, page 42)
Service log
The service log format is: ServiceLog- yyyymmddTtime.zip.
This log is password protected and it is designed to be analyzed only by BOSCH technical support.
There are two options that can be used to retrieve the DIVAR Service log:
Via the local user interface of the DIVAR
- Insert a USB memory stick into the DIVAR
- Log in using the administrator account
-
Access the main menu by right-clicking the mouse for the Quick menu, and select Main menu.
-
Go to Export section
-
Select the USB stick from the Selected device drop-down menu
-
Press the Shift button on the front panel of the DIVAR, immediately followed by the
(arrow up) button
-
You will prompted with a pop-up dialog to save the service log. Select to save the service log onto the USB stick.
- The service log is saved in a password protected .zip archive onto the USB stick.
Via the web interface of the DIVAR
- Start your browser and make sure that you can reach the DIVAR by entering <IP-address> of the unit as URL.
- In address bar enter: http://<IP-adress>/cgi-bin/loadSvrfile/ServiceLog.zip
Important: URL is key sensitive! - A pop-up dialog will appear prompting you to enter the DIVAR credentials “The server <IP-address> is asking for your user name and password”. Enter the credentials for the administrator account.
-
If the credentials are valid, the file download dialog will appear asking if you want to open or save the file. Choose a preferred location on the PC to store the file and save it there.
-
The service log is saved in a password protected .zip archive in your location of choice.
Network captures on request
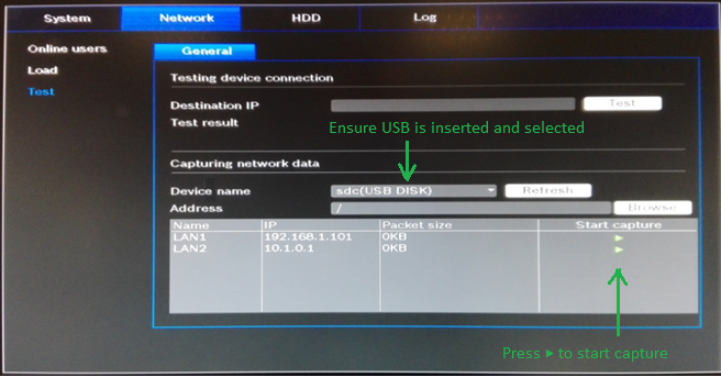
Network captures can be started locally on the recorder from the Info -> Network -> Test menu. One needs to connect USB stick and ensure that it is selected before starting the network capture)
System, network and HDD general information and health indicators
Such information can be found in the Info menu, of which you can provide relevant screenshots.
System
Alarm
View here the alarm status of your system:
- System alarms (No disk, Disk error, No space on disk, Network lost, IP conflict, Temperature too high, Other)
- Event alarms (Motion detection, Video loss, Camera input, NVR input). Use the scroll arrows to view all camera events
Health
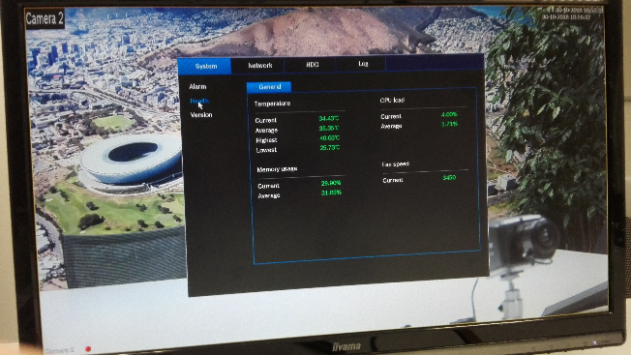
View here the health status of your system:
- Temperature
- CPU load
- Memory usage
- Fan speed (only for DIVAR 3000 models) - values shown are Current, Average, Highest,Lowest)
Version
View here the status of your installed system:
- hardware features (device, channels, alarms in/out)
- software features
- system version of your currently installed firmware
- build date of the firmware
- web id
- serial number
Network
Online Users
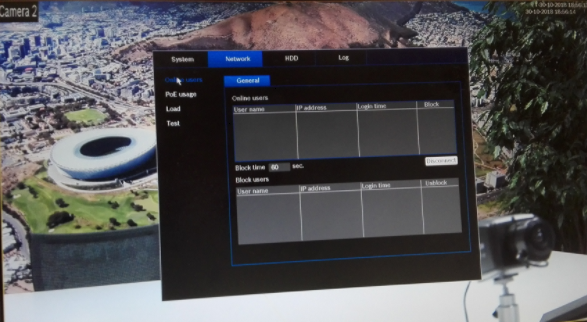
Manage here the online users:
- Disconnect a user by selecting the user and press <Disconnect>.
- Block a user for a max disconnection time:
- Select the user
- Click Block time (default is 60 seconds) and select <Block >
The system displays a list of the blocked users, and refreshes every five seconds to detect any newly added or deleted users. To unblock a user, select the user and choose <Unblock>
PoE usage
This info page shows a list of all cameras connected to the PoE slots, and the total amount of power they are using. Use the Block checkbox for a camera to prevent the camera drawing aPoE supply from that slot.
Load
See here a real time graphical display of the current load on the network for send and receive traffic. There are two network connections and the load can be seen for each network by selecting the relevant network interface.
Test
Choose here to do a network test as follows:
- Enter a Destination IP address.
- Click <Test>.
- Check the test result in the Test result field.
Or choose to do a Network sniffer packet export as follows:
- Enter a Device name (click <Refresh> if the device is not shown).
- Enter an Address (click <Browse> to search for the correct path).
- Select LAN.
- When the correct sniffer packet is shown, click
to start the export
HDD
General
This screen provides information on the current status of each HDD. After a system start, the system will first check for any HDD error.
- Earliest recording: shows the date and time of the oldest recording still available on HDD.
- Latest recording: shows the date and time of the latest recording on HDD.
- Recording status: shows if HDD can record or not.
- Raid status: shows if HDD is used in a Raid array. Using RAID severely reduces system performance (to maintain fluent playback, it is recommended to limit the number of playback channels (e.g. 1x or 4x playback).
- Total protected size: shows the total size of all protected recordings stored on the HDD (you can protect a recording using the Protect Playback function available on the Search/Play screen).The bottom half of the screen lists each HDD type, total size, and the free space remaining on the disk. Use the Health menu for more (Smart) information.
Health
Scan
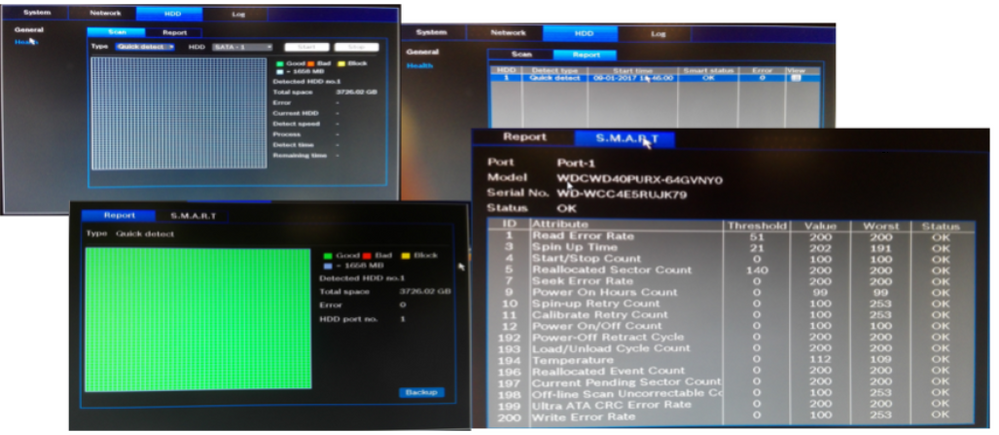
Start a scan here to view the current status of all sectors on the HDD(s) installed in your unit. A graphical representation of the HDD segments is shown, plus a readout of the health status of each HDD.
Start the scan as follows:
- Choose Quick or Full detect.
- Choose the HDD to be scanned.
- Press <Start>.
Report
After a scan is run on your HDD, use the Report tab to display a quick overview of the result. Any detected errors will be shown in the Error column (O means current HDD is normal; X means there is a disk error; – means there is no HDD; ? means disk is damaged).
If more detailed information is needed, select the 'report icon' under the View column (here you can also select the S.M.A.R.T. tab - see below).
To make a backup of the report:
- Insert a USB stick into an empty slot on the unit.
- Choose <Backup> to export the report to the USB stick.
S.M.A.R.T.
Choose here to display all of the Self-Monitoring, Analysis and Reporting Technology information that is automatically collected by the monitoring system included in hard disk drives (HDDs) and solid-state drives (SSDs). This system reports on various indicators of drive reliability, with the intent of enabling the anticipation of hardware failure.
Troubleshooting and information collection examples - Use cases
When connection issues in general are reported, please provide the following information:
- Device INFO
- Service logs
- Information about the network settings (for the external and internal network, as well as used ports - provide screenshots) and physical network connections/ network diagram
- Information about the viewing software used, which DIVAR network the software is connecting to (external or internal), behaviour in the software
- Behaviour of the DIVAR web interface
- DIVAR max bandwidth and connection configured (Settings -> Network -> Bandwidth)
- DIVAR performance indicators when the issue occurs (Info -> System -> Health)
- DIVAR number of online users when the issue occurs (Info -> Network -> Online users)
- DIVAR network load when the issue occurs (Info -> Network -> Load)
- DIVAR network capture when the issue occurs (Info -> Network -> Test)
When connections issue related to the DIVAR Mobile Viewer app are reported, please check and provide the following in addition to the information needed for troubleshooting general connection issues:
- Mobile app version used
- Mobile device details, e.g. device model, Android/ iOS version etc
- Type of connection: from within the same LAN as the DIVAR or a different network/from the WAN (e.g a 4G connection)?
- Is the DIVAR still reachable via a PC browser from the same LAN/ from the WAN?
- Important to check the correct port forwarding for WAN connections.
Still looking for something?
- Top Results


