- Top Results
- Bosch Building Technologies
- Security and Safety Knowledge
- Security: Video
- How to remotely view and collect the DIVAR IP 6000 or 7000 (R2&AIO) system's event log thr...
How to remotely view and collect the DIVAR IP 6000 or 7000 (R2&AIO) system's event log through IPMI?
- Subscribe to RSS Feed
- Bookmark
- Subscribe
- Printer Friendly Page
- Report Inappropriate Content
 Find attached the French version of this article!
Intelligent Platform Management Interface (IPMI) is a security guard for your server. Some primary functions of IPMI are to monitor hardware status (including temperatures, power consumption, voltage, etc.), log server data, and allow access to the server even when an operating system is not installed or is malfunctioning.
IPMI gives you the ability to manage servers in remote physical locations regardless of the installed operating system.
This procedure is applicable for DIVAR IP 6000/7000 (R2 & AIO).
Follow the steps below and find out how you can remotely view and collect the system's event log through IPMI..
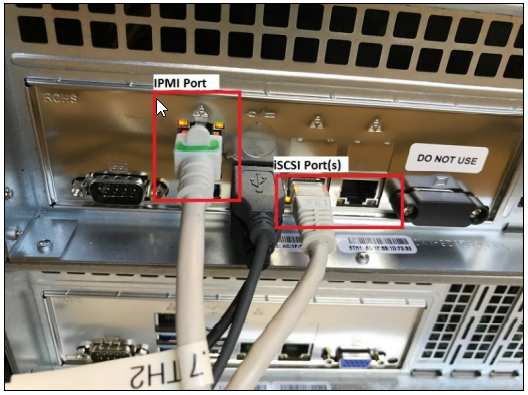
First, please make sure that a LAN cable is connected to the IPMI port on the back of the DIP:
Note: IPMI port is set by default to obtain automatically the IP address. Therefore, a DHCP server is needed.
If there is no option to have physically a router with DHCP server on it, then please refer to the following article and find out how to assign IP address to a DIVAR IP 7000/ 6000 through haneWIN DHCP server software.
Step-by-step guide
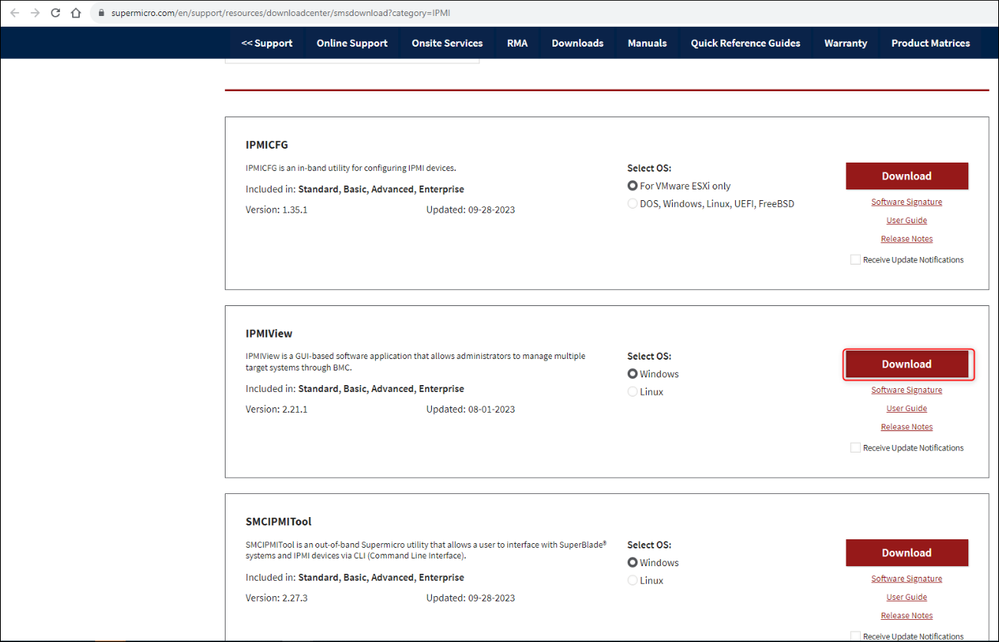
The IPMIView software can be downloaded from here:
https://www.supermicro.com/SwDownload/SwSelect_Free.aspx?cat=IPMI
To be able to download IPMIView, you will be asked to either login with your account in case you have one or to continue as guest and fill in your details (work e-mail, name and company).
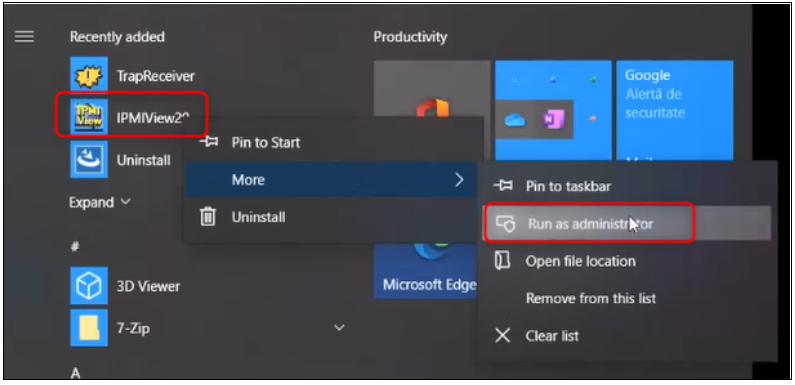
1. Install the software and open it by selecting “Run as administrator”
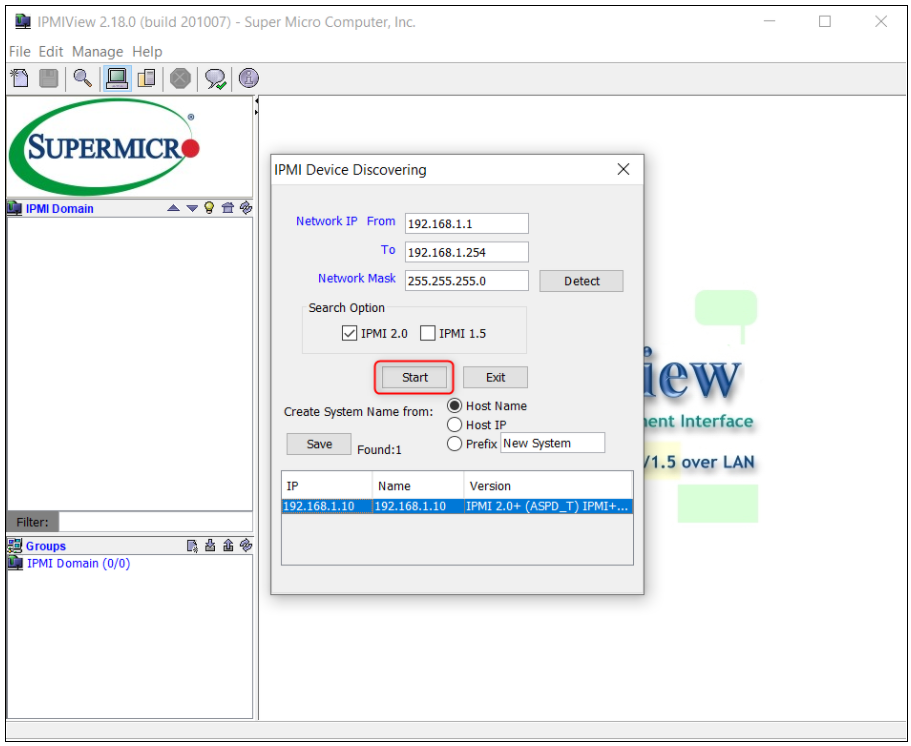
2. Discover IPMI Device
IPMI View software offers a feature that will detect all devices or systems currently connected to the network.
Click the ‘File’ button and select ’Discover IPMI Device’
You may specify a Network IP address range and network Mask, then click Detect or Start to search for any IPMI devices or systems that are connected to the IPMI tool connections.
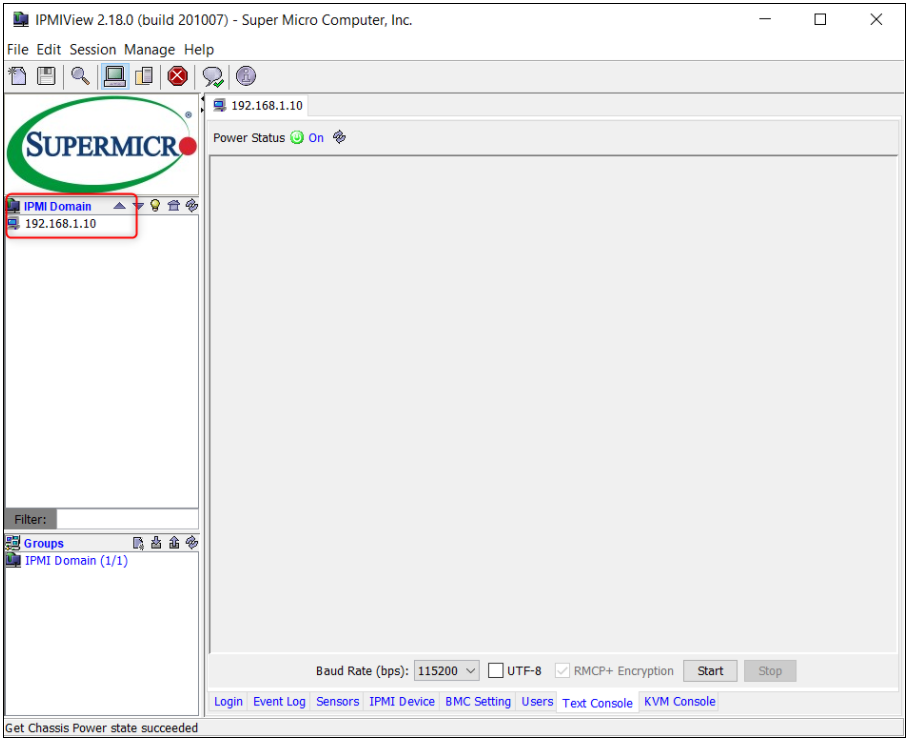
3. Select the IP address of the device for which you want to collect logs and click "Start" and "Save"
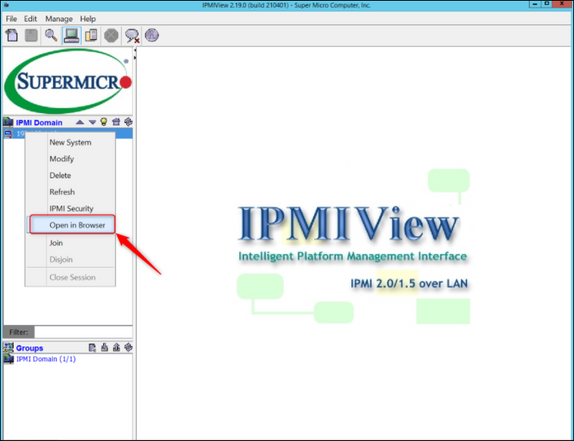
The selected IP will be found in IPMI Domain section
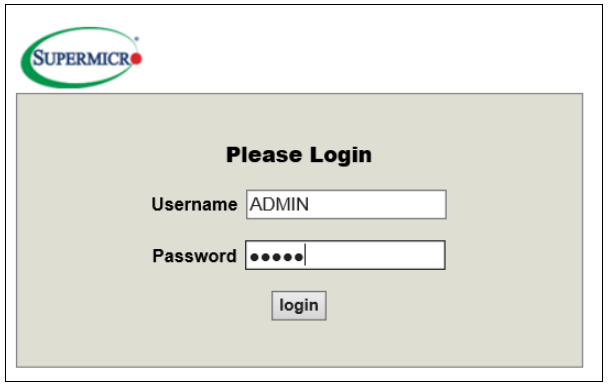
4. Once you are connected to the remote server via IPMI Console Redirection, the following IPMI Login screen will be displayed:
Enter the username & password and click Login.
Default credentials:
- Username: ADMIN
- Password: ADMIN
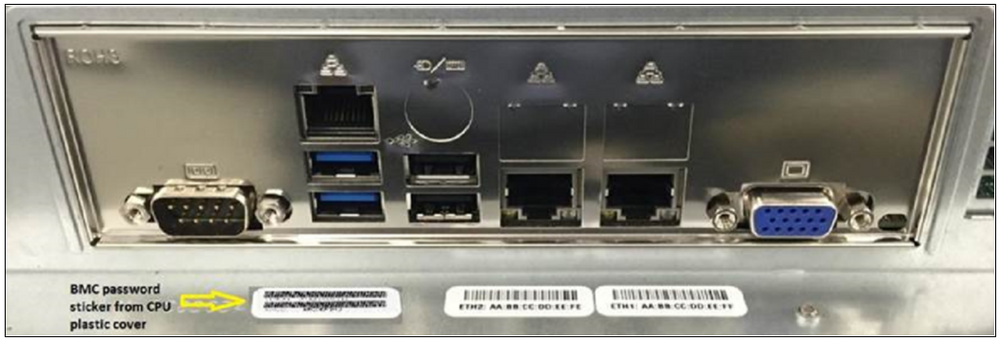
❗ Notice: Units that have been produced after 2020: access to the IPMI are no longer made with ADMIN / ADMIN credentials.
The user remains ADMIN, but the password is unique for each unit. The password can be found on the label on the back of the unit.
Applicable for:
- any unit that has IPMI and was produced after 2020
- any motherboard replaced in any system, even older, if the new component was produced after 2020
You have 2 options to collect the Event Log: via web browser or directly from IPMIView tool:
A) IPMIView Tool:
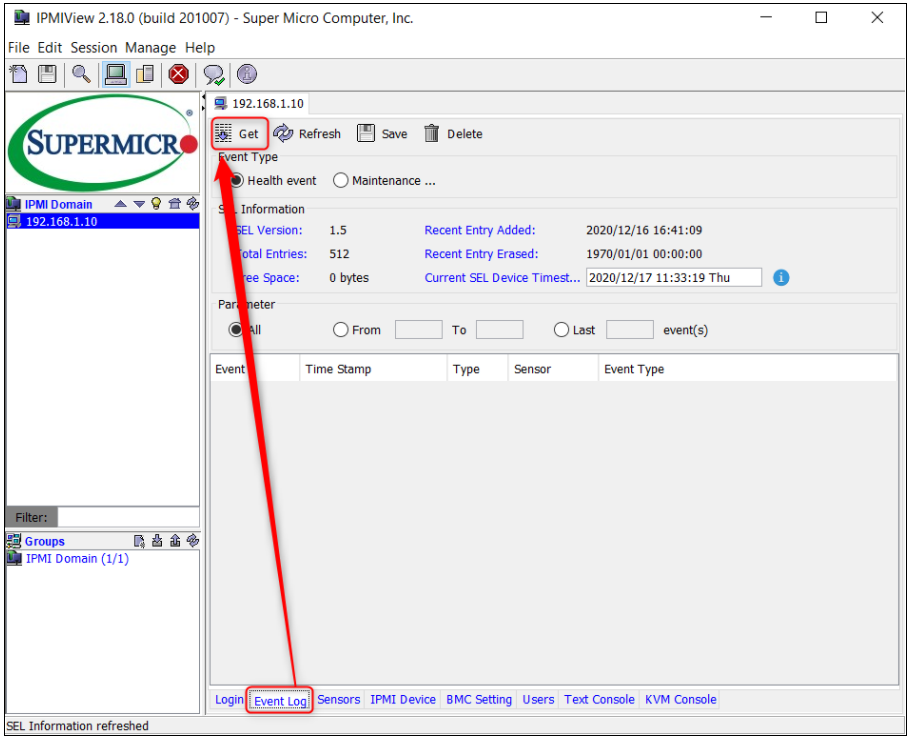
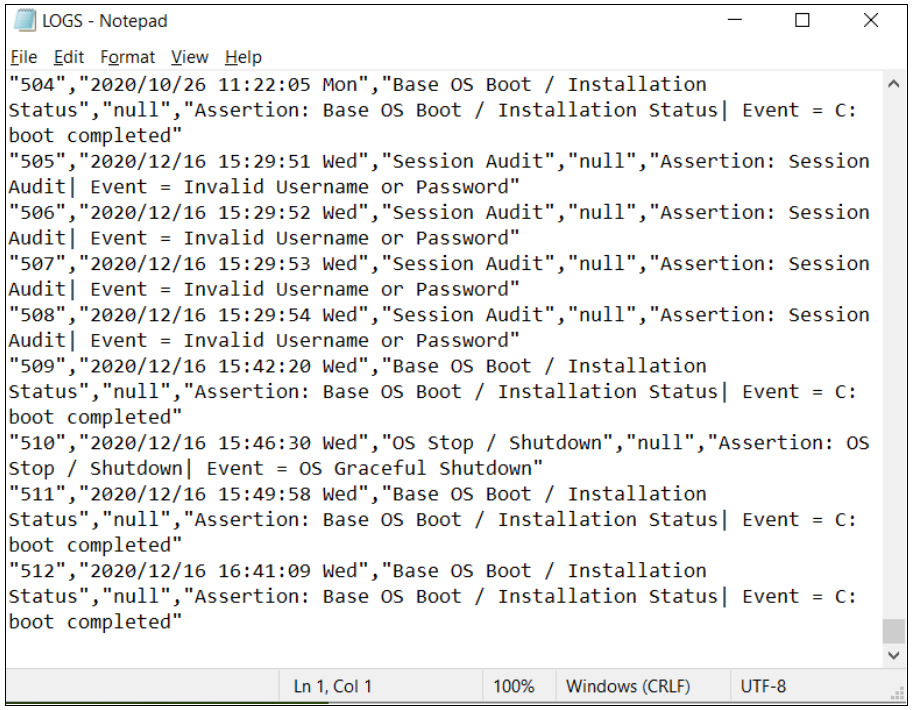
1.Select Event Log tab > choose the Event Type you want to collect (Health event/ Maintenance) and click the “Get SEL Records” button
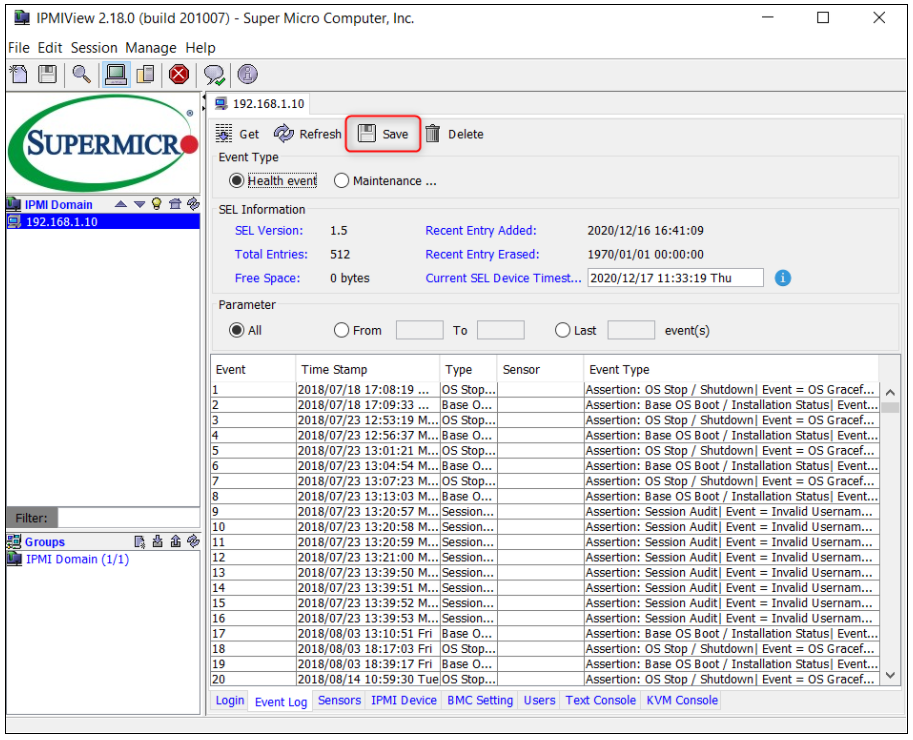
2. Once the events are displayed, you can export them in one .txt file by clicking the Save button
Note:
Current SEL Device Timestamp: This item displays the timestamp of the current device.To learn about the rules, click the information icon
B) WEB browser:
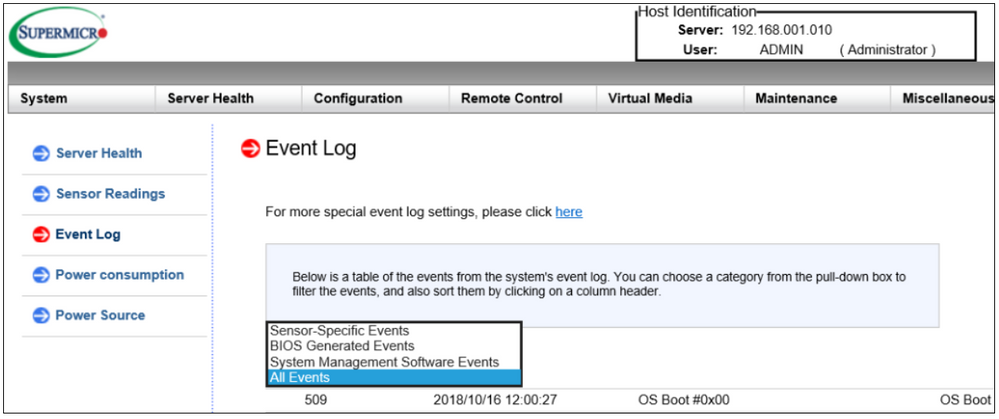
If you would like to sort the system’s events log, you can choose a category from the drop-down list in the WEB view.
The event log you can choose may be as follows:
- All events
- System Management Software Events
- BIOS Generated Events
- Sensor Specific Events
1. Open the web browser and type the IP address of the unit found through IPMI
2. Enter the username & password and click Login.
⚠️ You need to have Java installed in your system to launch the console. So, be sure that you have the latest version of JAVA.
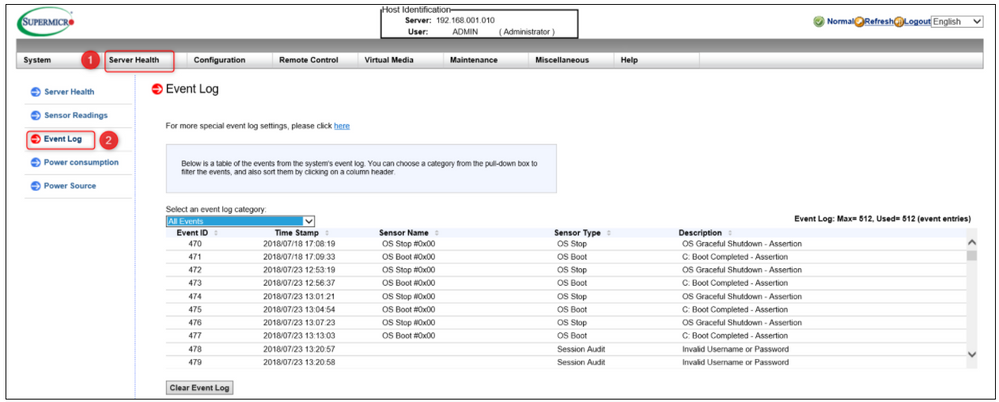
3. Go to 'Server Health' tab > Select 'Event Log'
4. Once the events are displayed, you can copy them into a .txt file and send it to the Central Support Team if they have requested you the logs.
Good to know:
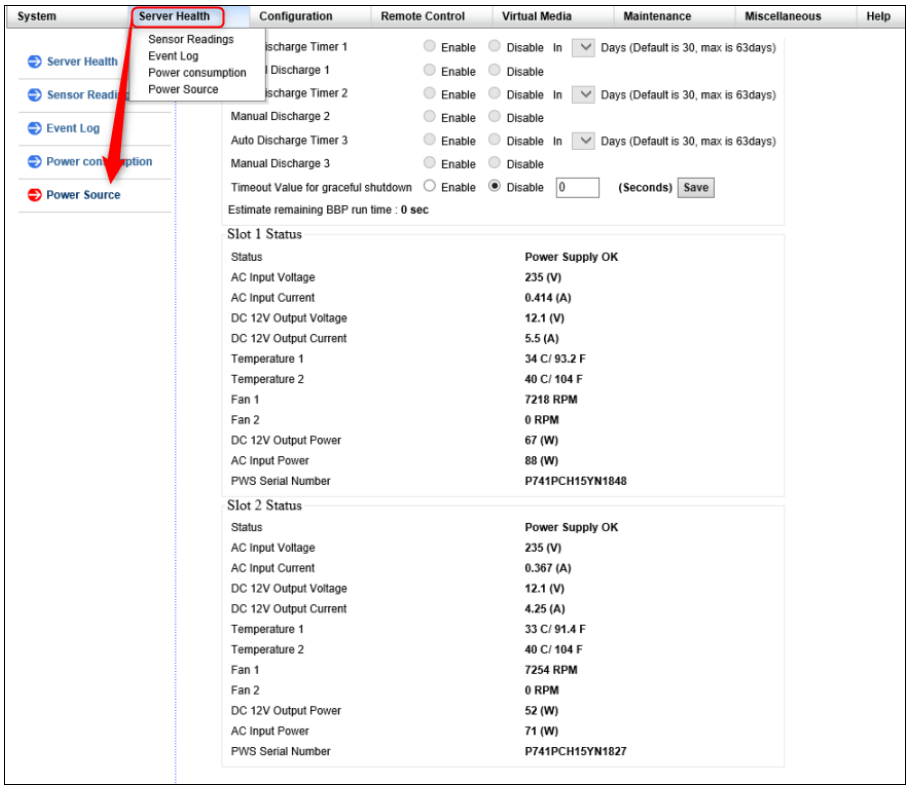
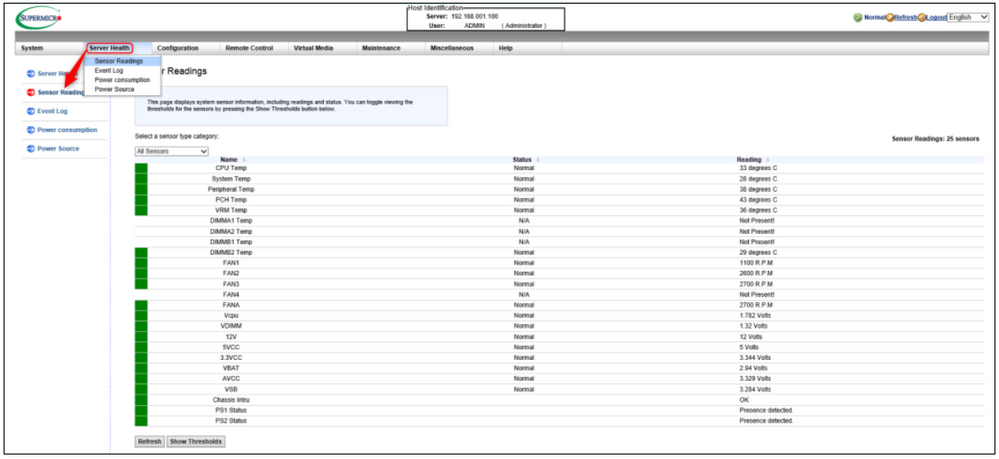
Also, in IPMI you can check the Power Source if SuperDoctor is not working and other information such as Sensor Recordings, Power Consumption.
You can find this information by clicking the 'Server Health' tab:
- Power Source:
- Sensor Readings:
- Power consumption:
|
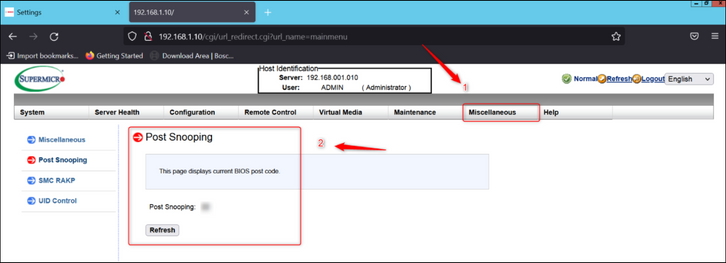
Tip If you were asked by Technical support to provide them with the Post Snooping code, please follow the steps below:
 |
Still looking for something?
- Top Results
