- Top Results
- Bosch Building Technologies
- Security and Safety Knowledge
- Security: Video
- How to find the Sensor readings of DIVAR IP (IPMI)?
How to find the Sensor readings of DIVAR IP (IPMI)?
- Subscribe to RSS Feed
- Bookmark
- Subscribe
- Printer Friendly Page
- Report Inappropriate Content
If you were asked by the Central Technical Support team to provide them with the Sensor readings picture during the troubleshooting process of your device, please follow the steps below.
⚠️First, please make sure that you have followed the article: How to remotely view and collect the DIVAR IP 6000 or 7000 system's event log through IPMI?
After checking the article above, you have 2 options to get pictures of the Sensor readings:
- via IPMIView tool
- via WEB
Step-by-step guide
1. IPMIView tool
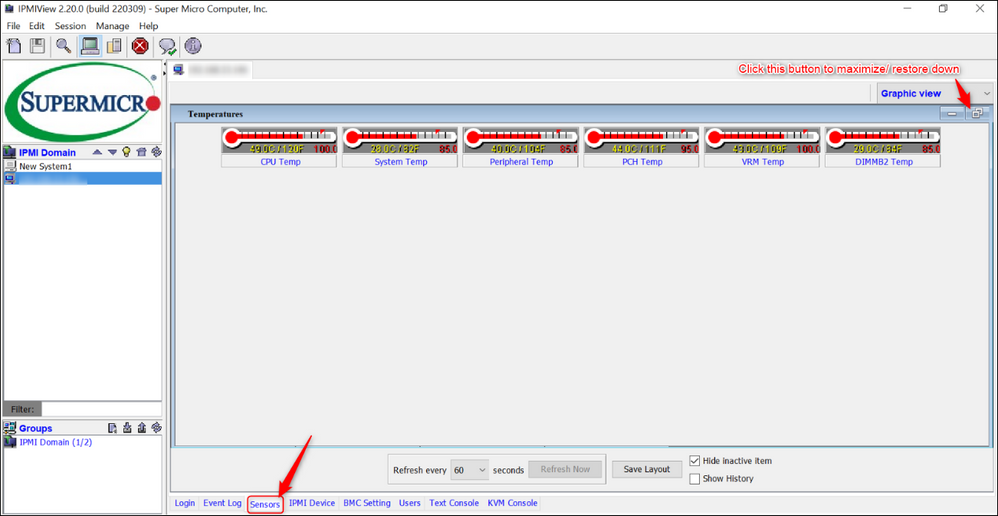
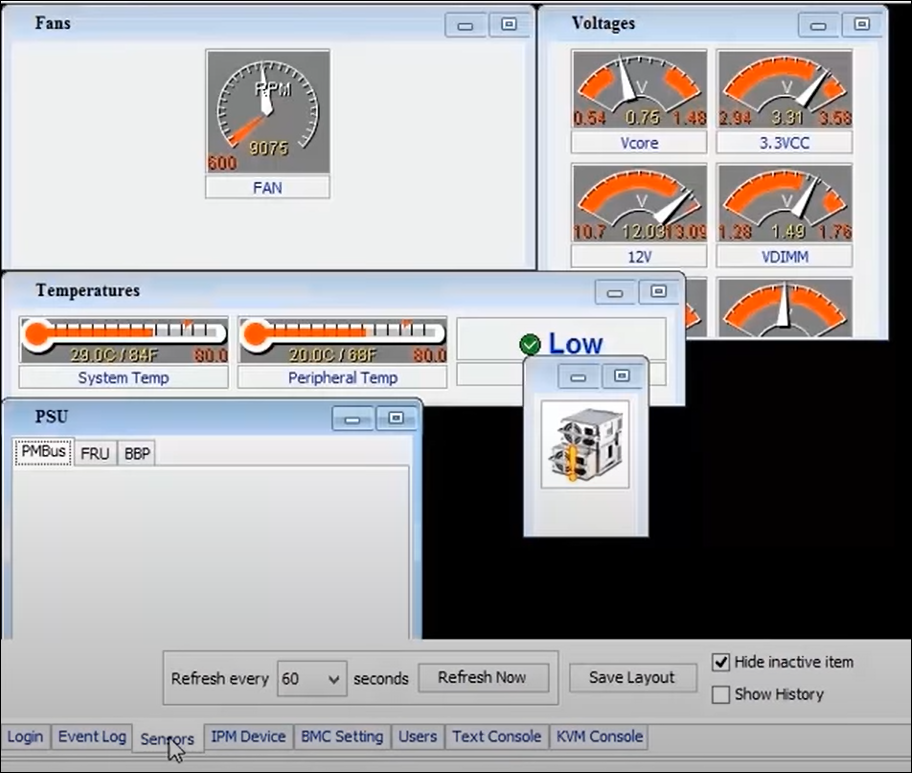
Once you are connected to the remote server and logged in, you will see the "Sensors" tab.
These are the Sensor readings pictures you can provide the Central Technical Support team with:
2. WEB:
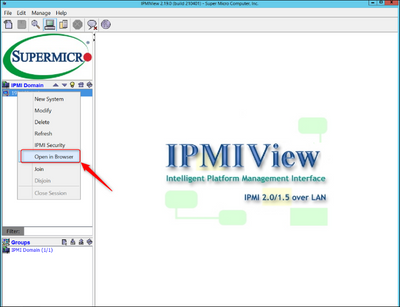
- right click on the IP address from the IPMI DOMAIN →
then, you will connect to the webpage of the IPMI tool
When you click on the Server Health, the following screen will display. Click Sensor readings to access information
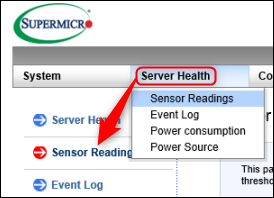
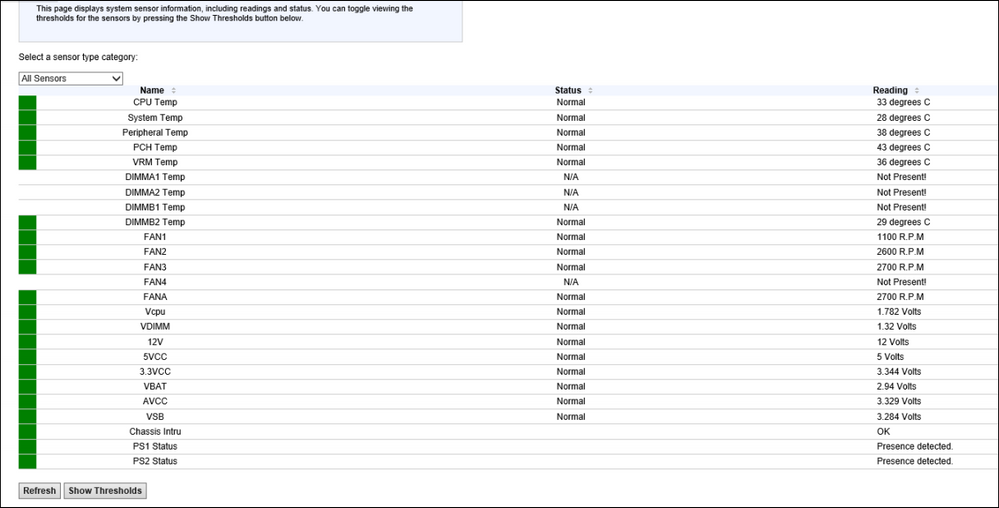
This page displays system sensor readings for the remote console.
Note: The system will be able to detect some GPUs, but not every GPU will be detected and shown in the Sensor Readings. To find which GPUs are supported, please refer to the Supermicro website at
https://www.supermicro.com/en/support/resources/gpu
This is the Sensor readings picture you can provide the Central Technical Support team with:
Sensor type category:
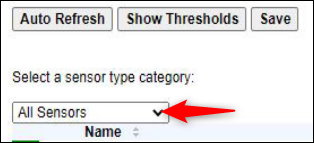
From the pull-down menu, select a sensor type (category). The options include the following:
• All Sensors
• Temperature Sensors
• Voltage Sensors
• Fan Sensors
• Physical Security
• Power Supply
• Battery
Color of the sensor
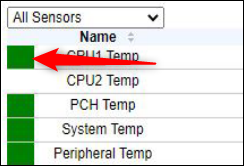
The color on the left of the sensor name indicates the status of that sensor.
• Green: It indicates that the sensor reading is normal. The system functions normally.
• Red: One or more sensors have reached a critical state. Immediate action is needed to resolve the problem.
• No Color: There is no sensor reading.
Help
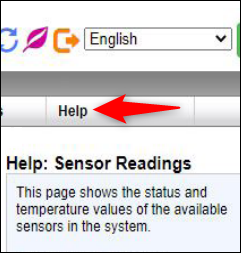
Click on the Help tab to display the Help menu. The menu displays the following information:
• An explanation of the green and red sensors.
• An explanation of each column on the page.
• The functions of each button on the page.
Note: The sensor readings overview can be also found in SuperDoctor (see this article)
Still looking for something?
- Top Results