- Top Results
- Bosch Building Technologies
- Security and Safety Knowledge
- Security: Video
- Who rated this article
Who rated this article
How to acces VRM monitor from BVMS Configuration Client?
Check if your system is performing correctly!
The VRM Monitor is one of the best options to check if the system is recording correctly, providing a quick overview as well as detailed information about all the cameras and storage added to VRM.
In this article you are going to see how to access VRM Monitor from Bosch Video Management System (BVMS) Configuration Client. Furthermore, you will find here some useful information about each section on the Dashboard page.
Step-by-step guide
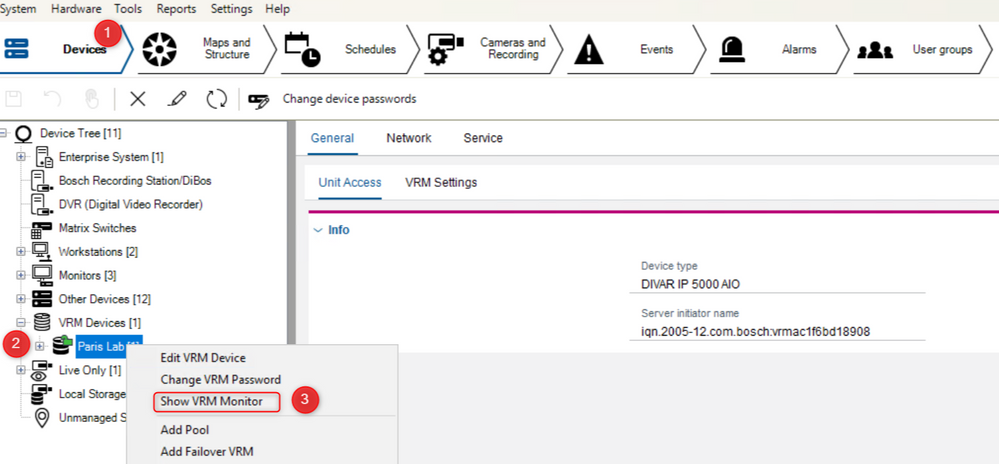
- Open Configuration Client and login using your admin credentials
- Form the Devices tab > expand the VRM Devices > go to your VRM device >right click on it and select Show VRM Monitor
The VRM Monitor window should appear.
💡
This is the overview of VRM page, version 3.60:
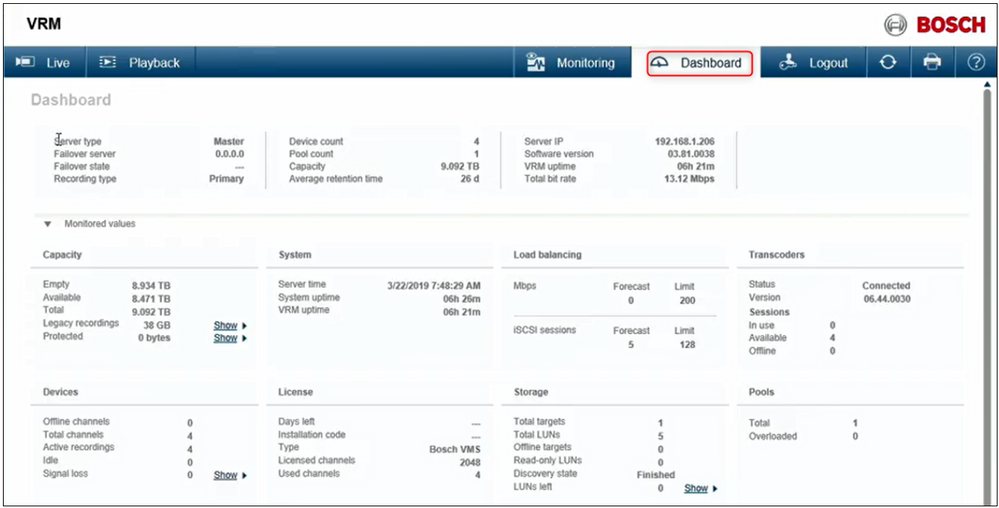
This is the overview of VRM page, version 4.03:
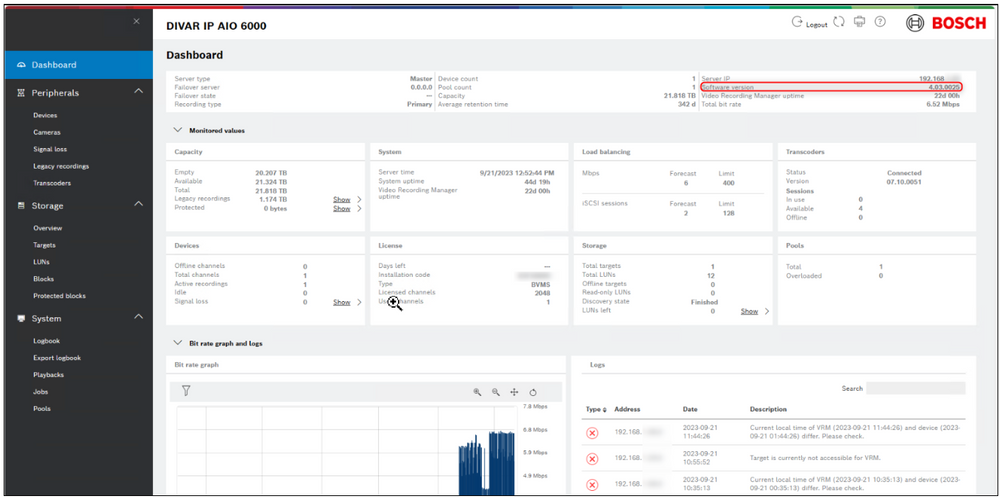
Under the Dashboard you are going to find very comprehensive information about your system. Such as:
- General information about the VRM Server, the Server IP Address.
- The Average Retention time which means how many days can the system record without overwriting.
- VRM Uptime - for how long time has the VRM server been functioning.
- The total bit rate - pay attention at the total bit rate so as not to exceed the hardware limit. If it exceeds the hardware limit, it means that your system may stop recording.
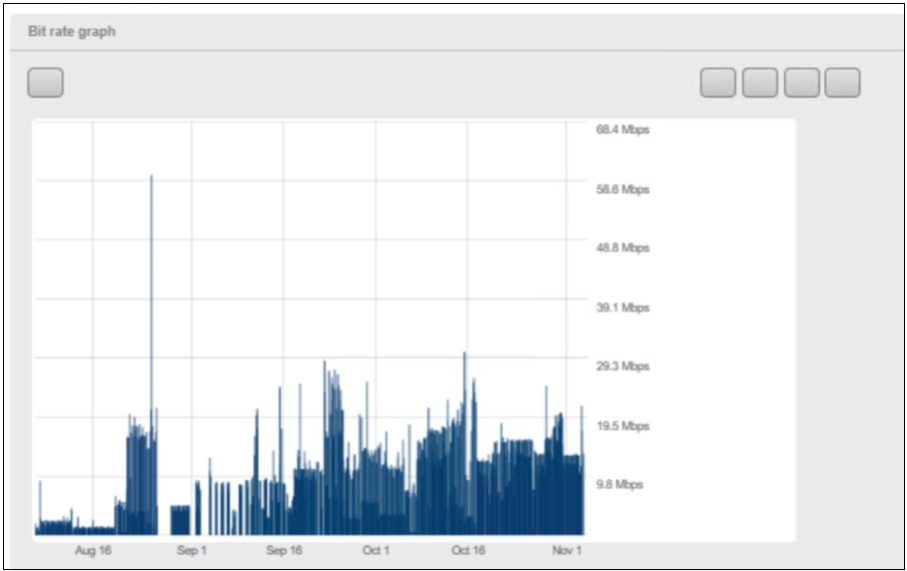
- At the bottom part of the Dashboard page, you can find the graphical representation of the bit rate for a longer period of time.
- Capacity overview: Here you can check the storage available which it can give you a hint whether you need to add more storage or delete some of the old recordings.
- In Transcoders section you can see how many transcoder sessions are available on your system.
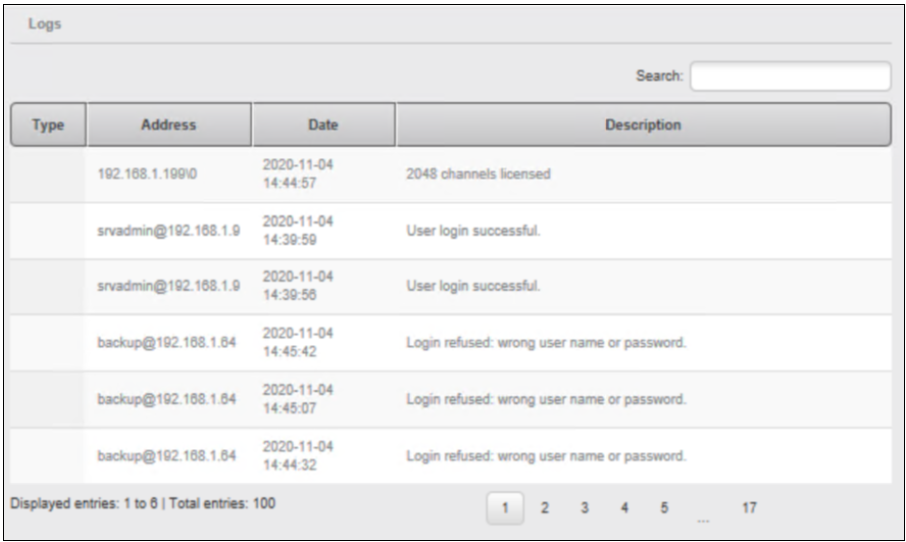
- Logs of the system: here you can see the list of warnings or errors in case of malfunctions.
Navigating the Dashboard:
The Dashboard provides a wealth of system information at a glance. While this page can seem overwhelming at first, we will cover each portion of this page section by section:
• General Information
• Monitored Values
• Graphs and Logs
Image
Several Hyperlinks exist in the page that allow quick access to specific menus in the “Monitoring” page. These Monitoring menus are covered in a later section.
Note: The VRM Monitor is a live webpage. Depending what is being tracked or tasks being performed, refreshing the page may be required on occasion.
1. General Information
The general information portion of the “Dashboard” provides base system information:
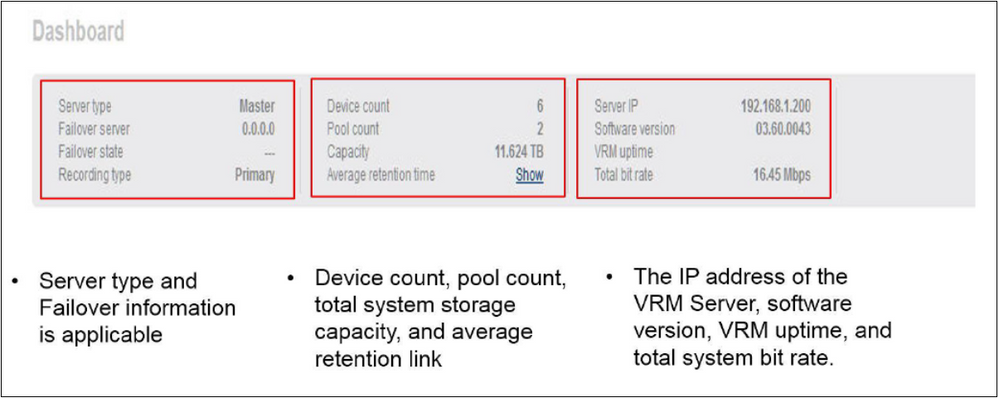
2. Monitored Values
The “Monitored values” portion of the Monitor page provides a wealth of information on the health and status of the system.

- Capacity menu - provides an overview of the system’s storage and storage status. This includes Total, Available, and Empty storage space. This menu also provides information on Legacy and Protected recordings:
• Legacy Recordings belong to device(s) that are no longer in the system and the minimum retention time of the video has not been reached. If the original device is to be replaced, the original recordings will “re-associate” with the new device - System menu - provides Time and Date information to include System and VRM uptime
- Transcoders menu - provides information and status of transcoders associated with a VRM system. This includes older VJ-XTC-XF external transcoders as well as internal transcoders supplied by recording appliances.
- • Mark I recording appliances are equipped with one (1) internal transcoder capable of one (1) transcoding instance
• Mark II appliances are capable of four (4) simultaneous transcoding session - Devices menu - provides total number of video channels configured in the system to include:
• Offline devices
• Active recordings
• Idle (not recording)
• And Signal Loss devices - License menu - provides base license information. In the example, the VRM is licensed by the BVMS it is associated with.
- Storage menu - provides a high-level overview of iSCSI devices in the system. This includes the total number of targets in the system, and the number of LUNs configured system wide.
- Pool menu - provides the number of virtual storage pools that are configured in the system.
3. Bit Rate Graph and Logs
This section of the Dashboard provides two useful tools:
- The Bit Rate Graph provides real time data of the system’s network throughput to the storage devices. The graph provides filter options that allow the following: 1hour, 1 day, 1 week, or 1 month. There is also the option of filtering based on a date-to-date basis.
- The Logs portion of this section displays the most recent logs, and also provides a shortcut “Go to Logbook”. The Logbook menu allows log filtering and exports. That menu is covered later in this document.
Still looking for something?
- Top Results
